Tuesday, June 28, 2016

Suu steam-rolling III: aRxiv for arXiv


I had known a bright young nuclear scientist trained locally who went abroad a long time ago to learn about handling nuclear waste. Coming from a rural family of farmers, he told me that he had quite some trouble using a tea-bag properly for his first breakfast at the hotel. Then I recalled myself watching a gentleman from Sri-Lanka making tea over a conversation. It was some five or six years earlier when I was in the Pacific. There I learned that the secret of good tea is to add one more spoon of creamer—for the cup—to the two spoonfuls I had added for myself! Yet, despite some time I spent outside of Myanmar I wouldn't be able to set the table myself because I don't know the proper places for knives, forks, or spoons and I'm surely ignorant of which brand of tea should go with which occasion. It's my karma and in no way could I have attended a classy high school or have a proper upbringing, if you like. But I won't regret.

For that matter, I never owned a car, or learned to drive one. I'm just happy that I learned to use computers and smart phones a bit. I am happy that I could share things with ordinary folks and that matters.

Then there is one website I would like to share. I've heard that it could replace some technical journals which you won't get free. Welcome open access. Welcome arXiv.


According to ProgrammableWeb -

The Cornell University e-print arXiv, hosted at arXiv.org, is a document submission and retrieval system used by the physics, mathematics and computer science communities. It has become the primary means of communicating manuscripts on current and ongoing research. The arXiv repository is available worldwide. Manuscripts are often submitted to the arXiv before they are published by more traditional means. In some cases they may never be submitted or published elsewhere. The purpose of the arXiv API is to allow programmatic access to the arXiv's e-print content and metadata.

The aRxiv is an R interface to the arXiv API and the arXiv API does not require an API key. You can install aRxiv from any of the cran mirrors.

Below is my R script for finding papers on machine learning published on arXiv from the beginning of 2010, and viewing abstracts on the arXiv website. Once on the abstract page you could download the full paper by using the link provided. On the other hand you could save the search results for the arXiv papers to a text file. Then you could conveniently view them with a spreadsheet.


When you run the script, you will see your commands and outputs, and error messages, if any, displayed one after another on the R console. I assume you know how to save them to a text file for reference. Near the end of the script you'll see the arxiv_open() function. That will open the abstract page shown below and here you can see that you could download the pdf file of the full paper:


After the run, you should also find the ML_aRxSrch.csv file you've saved in your working directory. Part of it is shown below opened with the Open Office Calc spreadsheet. Some rows were hidden for convenience in displaying:


My purpose here and in some earlier posts is to introduce (to myself as well as others) some tools that could take advantage of the web APIs provided by publishers, Q/A sites, social media, and others. For simplicity I've been leaving the contents of their results untouched. However, I couldn't help feeling inspired by an instance of the struggle for ever greater understanding of older vs. newer ideas as I read this abstract:

Neuroimaging research has predominantly drawn conclusions based on classical statistics, including null-hypothesis testing, t-tests, and ANOVA. Throughout recent years, statistical learning methods enjoy increasing popularity, including cross-validation, pattern classification, and sparsity-inducing regression. These two methodological families used for neuroimaging data analysis can be viewed as two extremes of a continuum. Yet, they originated from different historical contexts, build on different theories, rest on different assumptions, evaluate different outcome metrics, and permit different conclusions. This paper portrays commonalities and differences between classical statistics and statistical learning with their relation to neuroimaging research. The conceptual implications are illustrated in three common analysis scenarios. It is thus tried to resolve possible confusion between classical hypothesis testing and data-guided model estimation by discussing their ramifications for the neuroimaging access to neurobiology.

Despite my complete lack of idea on neuroimaging or neurobiology I sensed the promise that such improvements in knowledge would benefit our well-being somehow—collectively or individually. On the side, my feeling is that reading such abstracts could be something more than an idle recreation for the non-specialist. The bottom-line is that it may broaden our knowledge base or simply leave us with an appreciation of good things done (provided of course, that we could make any sense out of a given abstract).


Back to the basics: to play around with aRxiv package, a good start will be to read the vignette “aRxiv tutorial” in the help pages of “Html help” accessible from your R console. You could also download this tutorial here.

Friday, June 24, 2016

Suu steam-rolling II


The stackr package is an R package which you can use to get data from Stack Exchange family of websites. Well, the idea for a big part of my Bayanathi blog has been and will be to stick to “Yan can cook” philosophy. The only difference with Yan is that his demonstrations are based on his famous cooking and years of demos—mine were based on seeing some nice recipes followed by my first attempts to cook them! Currently I am trying out some “Suu” recipes so that my fellow dummies may “Tuu” and (granted that my dishes were too salty, oily, or smelly and somewhat burnt) improve on them to get to “Pyuu” finally.

Stack Exchange is a network of question and answer Web sites on topics in varied fields, each site covering a specific topic, where questions, answers, and users are subject to a reputation award process. The sites are modeled after Stack Overflow, a Q&A site for computer programming questions that was the original site in this network. The reputation system allows the sites to be self-moderating. (Stack Exchange, Wikipedia)

Stack Overflow is a privately held website, the flagship site of the Stack Exchange Network, It features questions and answers on a wide range of topics in computer programming.As of April 2014, Stack Overflow has over 4,000,000 registered users and more than 10,000,000 questions,with 10,000,000 questions celebrated in late August 2015. (Stack Overflow, Wikipedia)

Since by default, stackr search takes your query to the Stack Overflow website, it would be good to read about it now, or later after trying out stackr. In my own dumb way, I went to Stack Overflow, for example, and read about machine learning and related topics as far my as my budget allows for internet access through my cell phone. Mostly skimming over the contents and after getting tired, bored, or frustrated I would look for something that I could do with my own hands like some interesting R script to run related to what I've been reading. Or the process could have been reversed as I would have a minimal reading of an interesting topic, found some analysis I could replicate, tried it, and went on to search and read until I am through with it, or decide to stop. For yourselves, choose your styles of working, or no style at all. But enjoy them all the same.

So there is an introduction to stackr by its creator: Introducing stackr: An R package for querying the Stack Exchange API (David Robinson, Variance Explained, Feb. 4, 2015). He noted:

The package is straightforward to use. Every function starts with stack_: stack_answer to query answers, stack_questions for questions, stack_users, stack_tags, and so on. Each output is a data frame, where each row represents one object (an answer, question, user, etc). The package also provides features for sorting and filtering results in the API: almost all the features available in the API itself. Since the API has an upper limit of returning 100 results at a time, the package also handles pagination so you can get as many results as you need.

He went on to show how to analyze a single user's answering activity including the mean number of accepted answers, how the answering activity changed over time by counting the answers by month and changes in answering activity in the course of day at hourly intervals and made graphs. He also showed how to count the numbers of answers for different tags and make a bar chart as well as a wordcloud out of that.

However, for this post, I've tried getting similar kind of data we've got out of Reddit using the RedditExtractoR package as we've done for our last post. In Reddit you can use search terms and then subreddits to restrict the search to particular grouping(s) of entries organized by areas of interest called subreddits. In Stack Overflow, the item similar to a subreddit is a tag. For example in Reddit you use subreddit = “machinelearning” and in Stack Overflow you use tag = “machine-learning”.

Our Suu exercise plan would be similar to that for Reddit:
  1. You use stack_search() function for a tag, say “machine-learning” and with the word “mining” in the title of the question.
  2. As with Reddit in our last post we will ask for three pages of result, but accepting the default page size; (unlike RedditExtractoR which returns a fixed page size of 25 entries, with stackr you can specify up to 100).
  3. In the Reddit exercise we looked at the most recent posts and chose one: “Google opens a Dedicated Machine Learning Research Center in Europe” which is a news post; here in Stack Exchange an original post could only be a question. And you would like to get the answers for the question with the largest number of views from the three retrieved pages, say. For that, you take the question_id for which the view_count is maximum. Then get the text of the question, answers to it, comments, etc. (However, I couldn't find way to do that in stackr yet, and so I have to do that in my own dumb way—using the browser by calling it from the R session). Here's my script:

After running the script you should see a webpage like this:


You should also find these two files in your working directory: (i) ML_stackrQ.csv, and (ii) ML_stackrQ.RData. Running the script given above to get the results mentioned should give no trouble at all, so also will be for you to try out different search terms and/or tags, or to choose which webpage to open to see the answers and comments, etc.

However, installing stackr may not be trouble-free, because this package is not available on the main cran repository for R packages as it was with RedditExtractoR package. It is available only from GitHub repository here.


Above screenshot shows stackr page on GitHub with “Clone or download” button clicked. I chose to download the ZIP file and then followed the instruction for installing it. You'll find the instruction when you scroll down the page a little.


I chose the second option. If so get yourself a good internet connection and be patient. Be prepared to get devtools and other 20-plus R packages installed on your computer first. They are required for installing stackr!

As I've seen, stackr may not be one to get you the body of posts such as questions, answers, and comments (as yet?). It is perfect for getting the date they were posted, date of last activity, edit date, closed date; qualitative data like if the question was answered, answer accepted or not, if the question has been closed by moderators, reason for that; and quantitative data like view_count, answer_count, score, owner_reputation score, and owner_accept_rate. Since your query return these values and others in an R dataframe, you should have no trouble doing analysis of your choice, including those shown by the stackr package creator Robinson linked earlier in this post.

P.S.
Lesson:
Sly work supervisors start you off with small batches.
So did I for exercises on Reddit and Stack Overflow with “Easier done than said” batches.
Each has been designed to give myself and my fellow dummies an accelerated sense of achievement. I don't know if that could qualify as an application of Nudge theory popular now-a-days with the executive branches of U.S. and Britain. (Bear with me, I'm showing off that I've heard of Nudge).

Risk:
Dropouts.

Sunday, June 19, 2016

Suu steam-rolling


For my previous post “DIY ethics or Ethics express”, I used the text mining software package “tm” to build a wordcloud from Google search results. Text mining is a particular class of data mining which Wikipedia defined as:

the computational process of discovering patterns in large data sets involving methods at the intersection of artificial intelligence, machine learning, statistics, and database systems. ...The overall goal of the data mining process is to extract information from a data set and transform it into an understandable structure for further use.

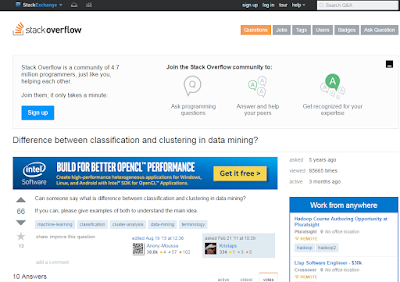
To be a bit more informed, I looked around on the web and found pieces like these from the Cross Validated and Stack Overflow websites:

I found similar questions/answers on Quora, like the following with 69 answeres:


TIL (Today I Learned …, borrowing from Reddit) one recent post (May 9, 2016) on R-bloggers website, which originally was from Sharp Site Labs, shares an expert's opinion on “What’s the difference between machine learning, statistics, and data mining?” Here Wasserman, a professor in both the Statistics and Machine Learning Departments at Carnegie Mellon, one of the premier universities for stats and ML”, declared that there is no difference. In his own words:

The short answer is: None. They are … concerned with the same question: how do we learn from data?

Further, the blog post gives reasons in support of this primary characterization by Wasserman and the following subtitles in the body of that post provided for me a neat (or actually, lazy) way to summarize.

The core similarities between ML, stats, and data mining
Nearly identical subject-matter and toolkits
The three cultures: why there are three identical subjects with different names

The core differences between ML, stats, and data mining
They emphasize different things
Machine learning is focused on software and systems
The purpose of data mining is finding patterns in databases
They use different words and terminology
ML, stats, and data mining tend to favor different tools
ML and data mining typically work on “bigger” data than statistics

Again: there are far more similarities than differences

Even then, we fellow dummies may benefit from more varied reading in this age of steam-rollers like big data, machine learning, data science and data revolution threatening to flatten a traditional discipline like statistics. Here, I have to confess that however much I tried to follow the discussions, controversies and the links provided from the pages of Stack Overflow, Cross Validated, Quora and others, a lot of them were, with me, TL;DR (Too Long; Didn't Read, again borrowing from the Redditors).

Talking about Reddit, it is “an entertainment, social news networking service, and news website”. It had 542 million monthly visitors (234 million unique users) and ranked 14th most visited web-site in US and 36th in the world in 2015 according to Wikipedia. Reddit has quite extensive posts and comments on Machine Learning in its “MachineLearning” subreddit as well as in related subreddits. Subreddits are different areas of interest into which Reddit entries are organized into. The following shows the screenshot of a part of the first page of of Machine-Learning subreddit showing threads in the “top” category.


Learning Machine-Learning (or for that matter Data Mining, or Statistics, or …) is obviously easier said than done. Yet we may approach any kind of learning through a three-step process: စု- တု- ပြု(suu-tuu-pyuu) or accumulate-imitate-create, as we Myanmars used to say. Turning our conventional wisdom upside down, I would now suggest that at least for the accumulation step, it could be easier done than said! In that context, I've started out with trying to give myself a DIY glimpse of the exciting world of getting data from web services, social networks and others through api (application programming interface). Now I'm sharing this— an api for the masses of some sort.

What we do now is get the posts on machine-learning from the Reddit website using the R package “RedditExatractoR”. We assume that you know how to use the R statistical environment and have the RedditExatractoR package ver. 2.0.2, the latest version, installed together with the two required packages, RJSONIO and igraph. Try running this script as I did:


By the end of the run you should find the following files in your working directory:

ML_getRed.csv
ML_contRed.csv
ML_get_cont.RData


If you have saved or printed the graph produced by the run to a file, you should get the following image of the graph of comments for the thread “Google opens a Dedicated Machine Learning Research Center in Europe” by the OP (original poster, another Reddit term) jay_jay_man posted on June 16, 2016.


You can see that I hadn't made the graph readable and pretty. That would require a bit of tweaking the plotting parameters and the RedditExatractoR help pages says nothing about getting it done. So, like every wise instructor I would just say that it is left as an exercise for the learner!

Anyway, the idea of the graph is great and the retrieval of data is super though we still miss some minor features and options on RedditExatractoR that are only available by visiting the Reddit website directly.


Postscript: We certainly hope to see some public or private or NGO/CSO or multi/bi-lateral agency websites in Myanmar offering data services through web api's sometime soon. My fellow dummies be ready! Not within the first hundred days, though.