Wednesday, September 27, 2017

Playing with microdata IV: response rates


The World Bank Group Country Survey FY 2014 for Myanmar which has been the subject of my last three posts has a low overall response rate of just 26%. Clearly, users may have to look beyond the survey data to make up their minds if the data reflect the opinions of the respective stakeholder groups.

That led me to look for the response rate situation of the opinion surveys in general. This paper, Understanding non response rates: insights from 600,000 opinion surveys by Germ´an Reyes, June 2016, seems to be a good one to look into. Contrary to my expectations, the paper was based on opinion surveys from Latin America, Spain, and more recently from the Caribbean and United States rather than a more global coverage. The data came from two databases arising from two complementary public opinion surveys:

The first one is conducted by Latinobar´ometro in 18 Latin American countries and Spain since 1995, interviewing about 1,200 individuals per country each year (with the exception of 2012 and 2014) about individual socioeconomic background, and preferences towards social and political issues. The second database comes from the Latin American Public Opinion Project (LAPOP). In addition to the countries covered by Latinobar´ometro, this database includes information from the Caribbean and United states, although the time span covered is shorter since the survey started in 2004, and the survey wasn’t conducted in 2011 nor 2013. LAPOP also interviews about 1,200 individuals per country each year about political issues. In both cases samples are representative at the national level for the voting-age population.

I was looking for response rates, that is, the percentage of respondents who responded from among the persons selected for interviewing. Alternatively put, I was looking for the opposite of those who didn't respond (the unit non-response). The paper however targeted at rates of non-response by each questions or group of questions (item non-response). In estimating the item non-response rates, denominator used in this paper was the total number of questions asked to an individual respondent and the numerator was the number of questions he/she chose not to answer. This ratio was then used as the dependent variable in regression analysis.


To my dismay I couldn't find any data on unit non-response rates in the paper and so I had to set a more modest objective of comparing unit non-response rates for World Bank Group Country Surveys from other countries in the ASEAN. Anyway, the figure-A2 shows that the public policies category had the lowest non-response rates compared to democracy, economy and socioeconomic categories. My guess is that it is so because we stand to lose or gain directly from public policies and our instinct, naturally, would be to let our voices heard on these matters.
If so why would we have a remarkably low response rate of 26% (a unit non-response rate of 74%)?

Some response rates for the World Bank Group Country Surveys for the ASEAN were:
Country
Number responded
Response rate
Year
Indonesia
316
29%
2015
Lao PDR
532
52%
2012
Lao PDR
164
45%
2015
Malaysia
258
30%
2016
Myanmar
173
26%
2014
Philippines
352
16%
2016
Vietnam
632
43%
2017
I am a bit more familiar with household surveys and I guess such big non-response rates would have been big problems there. Cited by Massey and Tourangeau response rate of less than 80% is officially considered to deserve serious attention in statistical surveys in the US:
The Office of Management and Budget’s Standards and Guidelines for Statistical Surveys, issued in 2006, recommend that investigators carry out studies like these to estimate the level of nonresponse bias whenever the response rate for a survey falls below 80 percent (http://www.whitehouse.gov/sites/default/files/omb/assets/omb/inforeg/statpolicy/standards_stat_surveys.pdf).

Before looking at the list of response rates for some ASEAN countries above, I thought that countries like Indonesia, Malaysia, and Philippines with more mature statistical systems and greater exposure of the public to sample surveys/opinion polls would have considerably better response rates than us. But in reality, even for the Malaysia with a higher response rate, 70% of stakeholder failed to respond! Perhaps opinion survey people have some tricks for living comfortably with such problems. Perhaps we could console ourselves that we were not that bad as far as response rates go in the ASEAN.

But can't we get a better response rate and what is hindering that? For me, I would've thought a little and write down my three development priorities straight. But think again, those stakeholders, those experts, were not answering that question only. The overall objective of the World Bank Group Country Survey in Myanmar was for “gaining a better understanding of how stakeholders in Myanmar perceive the Bank Group”. And for that matter they were to answer questions relating to:

Their overall attitudes toward the World Bank Group in Myanmar;
Overall impressions of the World Bank Group’s operations, knowledge work and activities, and communication and information sharing in Myanmar;
Perceptions of the World Bank Group’s future role in Myanmar.

I don't know what the stakeholders would have thought. But for a dumb guy like me, those questions look formidable. Despite the assurance of confidentiality, what if I couldn't come up with answers that were not intelligent enough? Like me, those stakeholders who didn't respond were worried that their reputations would be at stake in answering those questions and so they chose to play safe, I imagined.

For some time I've been laboring with this feeling of hopelessness for all our peoples trying to make a peaceful and simple living and playing our part with dignity in our planet, because there have been so many distractions within and without. I don't really know if I've cheated myself being convinced that there are all-purpose solutions to these, and slept well thereafter. Seems like we need to get more educated (get more ပညာ) to face all internal issues and look for effective “small state survival strategies” for external affairs. I guess getting more educated would mean getting better informed, getting more knowledge, and getting wiser. I'm not smart enough to say what underpins “small state survival”, but I could mention successful examples like Switzerland and Singapore, among others.

One glossary of Pali terms gives ပညာ as:

paññā:Discernment; insight; wisdom; intelligence; common sense; ingenuity. One of the ten perfections (pāramīs).

In the context of this post, the respondents don't need intelligence or ingenuity to outsmart the data collectors; they could just use their common sense and be strong enough to speak out, I would say. What is there to be afraid? After-all, we have to be masters of our own fate.


Sunday, July 30, 2017

Playing with microdata III: parallel sets etc


This sample of parallel sets plots gives us colorful crisp images with clear messages to match. Their favorite theme of illustration seemed to be the casualties of the Titanic disaster and as I can see parallel sets spares you the effort to create a vivid mental image of the tragic true story. This is from Kosara_BeautifulVis_2010.pdf .


My attempt at visualization of development priorities by stakeholder groups which has been the theme of my last two posts, now using parallel sets, wasn't so clear:


This may be because every stakeholder respondent has the choice of up to three development priorities out of the given thirty-five, making the result too complex for clear visualization. Justin in Games of Thrones Parallel Sets Data Visualization, gives his rule of thumb:


What can we do with our complex data? May be we could follow the lead of Markus (from my last post):


His idea is to simplify the data by taking the top 10 distinct three-response sets by number of occurrences. For this we first need to convert the dataframe based on individual respondents to grouped dataframe with distinct response triplets (r1-r2-r3) and their frequencies (n), like this:

    r1 r2 r3 n
 42 11 19 20 5
 65 19 20 21 5
  9  4  5 11 3
 61 11 20 21 3
121 18 20 34 3
 10  3  9 11 2
 23  4  5 20 2
 26  3  9 20 2
 28  2 13 20 2
 33  4 14 20 2

This resulted in the parallel sets plot:

So far so good. But the problem is that the top-10 response categories just covered 29 respondents out of 170 (17%), and biggest n is 5 only! Also, going down the rows of the dataframe is useless because we'll be getting down to frequencies of 1.
This is the script for producing my two parallel sets plots:

        # parallel sets plot using ggparallel package
        # myint thann, July 28, 2017

        # import data
        library(foreign)
        x <- read.dta("myanmar_cs_fy14_datafile_with_dk_.dta")

        # ---- extract and manipulate data
        # (1) extract data on development priorities + stakeholder groups       
        xa2g1r <- x[,c(1,3:37,447)]                         
        # (2) convert factors to integer
        xa2g1r[,2:36] <- lapply(xa2g1r[,2:36], as.integer)      
        # (3) convert NAs to 0 in development priorities
        xa2g1r[,2:36][is.na(xa2g1r[,2:36])] <- 0 
        # (4) convert 2 to 0 in development priorities
        xa2g1r[,2:36][xa2g1r[,2:36]==2] <- 0
        # (5) remove persons with no response in development priorities
        xa2g1r <- xa2g1r[rowSums(xa2g1r[,2:36])>0,]         
        # ---- end extract and manipulate data

        # (6) create response data
        xa2g1r$r1 <- 0
        xa2g1r$r2 <- 0
        xa2g1r$r3 <- 0

        # (7) create first, second, and third responses
        for (j in 1:170) {
            k = 38
            for(i in 2:36){
                if (xa2g1r[j,i]==1) {
                    xa2g1r[j,k] <- i
                    k=k+1
                }
                if (k > 40) break
            }
        }

        ###  run parallel sets plot
        #  (8) run parallel sets plot for all responses 
        library(ggparallel)
        ggparallel(vars = list("r1",  "r2",  "r3"), xa2g1r, method="angle")+
                         coord_flip()
        #  save plot
        ggsave("perset_all.png", width = 5, height = 5)

        #  run parallel sets plot for top ten most frequent responses 
        #  (9) create grouped data frame with number of respondents 
        #        for each distinct set of three responses
        xa2g1r_G <- xa2g1r[,38:40]
        xa2g1r_G <- aggregate(list(n=rep(1,nrow(xa2g1r_G))), xa2g1r_G, length)
        xa2g1r_G10 <- xa2g1r_G[order(xa2g1r_G$n, decreasing=TRUE),][1:10,]
        #  (10) run parallel sets plot for top ten responses
        ggparallel(list('r1', 'r2', 'r3'), xa2g1r_G10, weight = 'n', order = 0)
        #  save plot
        ggsave("perset_top10.png", width = 5, height = 5)

Notes:
  • In step (7) of my script above, I used loops to create data for regular dataframe with r1, r2, and r3. Attempting to avoid loops, I needed 10 steps to arrive at the equivalent dataframe used in my last two posts, poor me. You could certainly do that better.
  • Markus's code for producing the grouped data frame used the dplyr package:
    I used one of the three answers to Find how many times duplicated rows repeat in R data frame in stackoverflow by thelatemail that uses the aggregate function (see step-(9) in my R script above). Kudos to the versatility of R and the power of Q/A sites.


Monday, July 17, 2017

Playing with microdata II: my first parallel coordinates plot


This post gives “how to” of my first parallel coordinates plot with ggplot2. It wasn't my very first parallel coordinates plot because the very first was done with “parcoord” function from the MASS package. I also tried “parallelplot” of the “lattice” package, as well as “ggparallel” from the “ggparallel” package. You can't get parallel coordinate plot from the last one. I used it to draw “parallel sets plot” which is different though it is related to the parallel coordinates.

I was playing with the first two of those methods and still couldn't get the attributes of the plots such as headings, labels, and legends right when I stumbled upon “PARALLEL COORDINATE PLOTS FOR DISCRETE AND CATEGORICAL DATA IN R — A COMPARISON” by Markus Conrad in WZB Data Science Blog, from here.

The plot below

was produced by


and it needed a special type of data in “long format” using melt( ) funtion from the reshape2 package.

I thought I understood the long format idea. So I tried to do it on my own without using melt function from the reshape2 package. It worked, though the coding may have been really crude!

#-- myint thann, July 13, 2017
#-- extract data on development priorities from the microdata
#-- (Reference ID: MMR_2014_WBCS_v01_M; Country: Myanmar;
#   Producer:Public Opinion Research Group - The World Bank Group)
#-- and run first parallel coordinate plot with ggplot2

#-- import data
library(foreign)
x <- read.dta("myanmar_cs_fy14_datafile_with_dk_.dta")

# ---- extract and manipulate data
# (1) extract data on development priorities + stakeholder groups
xa2g1r <- x[,c(1,3:37,447)]
# (2) convert factors to integer
xa2g1r[,2:36] <- lapply(xa2g1r[,2:36], as.integer)
# (3) convert NAs to 0 in development priorities
xa2g1r[,2:36][is.na(xa2g1r[,2:36])] <- 0
# (4) convert 2 to 0 in development priorities
xa2g1r[,2:36][xa2g1r[,2:36]==2] <- 0
# (5) remove persons with no response in development priorities
xa2g1r <- xa2g1r[rowSums(xa2g1r[,2:36])>0,]
# (6) create dataframe of necessary variables for analysis
idg1 <- data.frame(row0=as.integer(row.names(xa2g1r)),xa2g1r[,c(1,37)])
row.names(idg1) <- 1:170
idg1$row <- as.integer(row.names(idg1))
# ---- end extract and manipulate data

## ---- create long form dataframe for use with ggplot2
# (7) get row, column ids of responses = 1 
#     create df, add variables for response 1,2,3
w <- which(xa2g1r[1:170,2:36]==1,arr.ind=TRUE)
w <- w[order(w[,1],w[,2]),]
wdf <- data.frame(w)
wdf$r1 <- 0
wdf$r2 <- 0
wdf$r3 <- 0
wdf$rid <- 0
# (8) make rid (response-id)
RF12 <- function (x) {
        col.x <- subset(wdf,row==x)$col
        xrid <- as.integer(as.factor(col.x))
}
wdf$rid <- unlist(apply(as.array(1:170),1,RF12))
# (9) create the list of dataframes for creating long form data for ggplot2
RF3 <- function (x) {
      r.x <- subset(wdf,row==x)
      r.x[,3] <- r.x[r.x$rid == 1,2]
      r.x[,4] <- r.x[r.x$rid == 2,2]
      r.x[,5] <- r.x[r.x$rid == 3,2]
      return(r.x)
}
z <- (apply(as.array(1:170),1,RF3))
# (9) make one dataframe from the list of 170 data frames
zdf.0 <- do.call("rbind",z)
# (10) remove duplicate rows
zdf <- zdf.0[zdf.0$rid==1,]
# (11) replace NA with 0
zdf[is.na(zdf)] <- 0
# (12) replicate rows to equal number of responses
#      for cases with less than or more than 3 responses
RF4 <- function (x) {
      z.x <- z[[x]]
      m <- nrow(z.x)
      xr <- row.names(z.x[m,])
      t <- ifelse(m==1, 2, 
                  ifelse(m==2, 1, 0))
      z.e <- z.x[rep(xr,t),]
      z.e <- rbind(z.x,z.e)
      return(z.e)
}
ze <- (apply(as.array(c(1:170)),1,RF4))   
# (13) make rid in replicated rows = (1,2,3, ...) and col=0
r123 <- function(x) {
      if (sum(ze[[x]]$rid)==5){
          ze[[x]][3,2] <- 0
          ze[[x]]$rid <- c(1,2,3)} else
      if (sum(ze[[x]]$rid)==3){ 
          ze[[x]][2,2] <- 0
          ze[[x]][3,2] <- 0
          ze[[x]]$rid <- c(1,2,3)} else          
      if (sum(ze[[x]]$rid)==6){} else
          {ze[[x]]$rid <- seq(1,nrow(ze[[x]]),1)}            
      return(ze[[x]])
} 
ze1 <- apply(as.array(1:170),1,r123)  
# (14) make data frame
zedf <- do.call("rbind",ze1) 
# (15) add stakeholder group = g1r to zedf        
pcdf <- merge(idg1,zedf,by="row")
# (16) add stakeholder group code
pcdf$sgcode <- factor(as.integer(pcdf$g1r))        
## ---- end create long form dataframe  for ggplot2

### ---- (17) run first par coord plot
library(ggplot2) 
y_levels <- levels(factor(1:35))
ggplot(pcdf, aes(x = rid, y = col, group = row)) +
       geom_path(aes(size = NULL, color = sgcode),
              alpha = 0.5,
              lineend = 'round', linejoin = 'round')+
       scale_y_discrete(limits = y_levels, expand = c(0.5, 0)) +
       scale_size(breaks = NULL, range = c(1, 7)) 
### ---- end first par coord plot with ggplot2

From my R-script above the steps from (1) to (16) produces the dataframe pcdf which looks like this:

From this we need only the variables rid, col, row and sgcode. I just plugged them in the in the right places in Markus's code and voila!


For the benefit of my fellow dummies (or shall I call them citizen scientists?) I will confide to them that I struggled for a long time before I got to see a plot and then the right plot. That was before I realize that the variable for “group =” has to be the variable that specifies the observations in a given case that are to be connected by lines (for my dataframe it was “row”). Hasn't Markus emphasized “# group = id is important!”?

The above plot was the prototype from which … I worked through trial and error with the help of various tutorials and question-answers from Cross Validated and Stack Overflow, among others … as I noted in my last post. Thanks to Marus and other guys I manged to get the parallel coordinate plots shown there.


Now is your turn.

Thursday, July 13, 2017

Playing with microdata


A little over a month ago I happened to have read the news about Myanmar Demographic and Health Survey and by the first week of June I had been able to download the microdata. It wasn't without frustration and struggle, though. Perhaps an exaggeration of my capabilities and my plan for analysis helped. Then, trying to fulfill the promise I made myself on producing something not so dumb out of microdata downloads, I chose the easy way out to compare population pyramids from the DHS and the most recent population results. Such was the theme of my last post.

How about trying my hand at a more refined graphing of complex data?

Looking around I found The World Bank Group Country Survey FY 2014 and promptly downloaded the microdata from the World Bank Microdata portal here. Unlike the microdata for the DHS, you don't need to make a formal request for it. All you need to do is to accept the “Terms and conditions” for the microdata by clicking the “Accept” button on that page, choose the data file format, and start downloading.

The Myanmar Country Opinion Survey is part of the County Opinion Survey Program series of the World Bank Group. It was designed to achieve the following objectives (Myanmar: The World Bank Group Country Survey FY 2014, Report of Findings, November 2014):

“Assist the World Bank Group in gaining a better understanding of how stakeholders in Myanmar perceive the Bank Group;
Obtain systematic feedback from stakeholders in Myanmar regarding:
Their views regarding the general environment in Myanmar;
Their overall attitudes toward the World Bank Group in Myanmar;
Overall impressions of the World Bank Group’s operations, knowledge work and activities, and communication and information sharing in Myanmar;
Perceptions of the World Bank Group’s future role in Myanmar.
Use data to help inform Myanmar country team’s strategy.”

Its methodology and scope of the survey were described as:

“Between June and August 2014, 662 stakeholders of the World Bank Group in Myanmar were invited to provide their opinions on the WBG’s work in the country by participating in a country opinion survey. Participants were drawn from the office of the President, Prime Minster; office of a minister; office of a parliamentarian; ministries/ministerial departments; consultants/contractors working on WBG-supported projects/programs; PMUs overseeing implementation of a project; local government officials; bilateral and multilateral agencies; private sector organizations; private foundations; the financial sector/private banks; NGOs; community based organizations; the media; independent government institutions; trade unions; faith-based groups; academia/research institutes/think tanks; judiciary branch; and other organizations. A total of 173 stakeholders participated in the survey (26% response rate).

Respondents received and returned questionnaires through the courier service. Respondents were asked about: general issues facing Myanmar; their overall attitudes toward the WBG; the WBG’s importance and results; the WBG’s knowledge work and activities; the WBG’s future role in Myanmar; and the WBG’s communication and information sharing.”
Quickly going over the contents I was most interested in knowing what the stakeholders considered

'the top three most important development priorities, which areas the government should focus on, which areas would contribute most to reducing poverty and generating economic growth in Myanmar, and how “shared prosperity” would be best achieved'.

Chapter-IV and General Issues sections of Appendix-A and Appendix-B reported findings directly relevant to my interest. I was interested in understanding how the stakeholders view the development priorities and the similarities and differences within the individuals and groups. For that matter, I couldn't imagine an effective way to summarize the three responses given by each of the respondent in the form of tables of data so that they would bring out patterns across the three responses and across individuals/groups. In our case the respondents were to pick three development priorities out of a list of 35 and I guess the most appropriate way to see the patterns in the data is to draw a parallel coordinate plot. As human beings we can't see more than three dimensions, but using parallel coordinates we can see multiple dimensions by representing all the dimensions in just two dimensions through parallel coordinates!

The following is the famous Fisher's Iris data plotted this way. You can find it under the entry “Parallel Coordinates” in Wikipedia.

In parallel coordinates, the idea basically is to have as many y-axes as the number of dimensions and connect the points on these axes for each individual, case or observation.

In the following plot I used the downloaded World Bank Country Survey data (Reference ID: MMR_2014_WBCS_v01_M; Country: Myanmar; Producer:Public Opinion Research Group - The World Bank Group) to create the parallel coordinates plot for the three Development Priorities picked by each stakeholder. Each line in the plot shows the response of each stakeholder and is identified with a particular color to show the stakeholder group which he/she belongs. I used R to process the data and the graphs were plotted with the ggplot2 package.

The first plot is for all the nine stakeholder groups. One thing clearly seen from this plot is that one respondent has gone over the three-response limit to give the fourth one. While the rest of the respondents gave three responses, one gave only one response and another respondent give only two responses.


As we can see, it is not easy to distinguish different stakeholder groups in the above plot because there were too many of them and the colors become hard to distinguish. To overcome this we could try making a particular group stands out by plotting it against the rest of the groups. The following is the plot of Media group vs. the rest made that way.


So far it looks as if the message from the plot is clear. You can see each respondent's pattern of response as well as the collective pattern for the group. From such plots it is relatively easy to judge if one group is more homogeneous or not in terms of responses or get an idea of the pattern of response for most popular development priorities, and so on. But I've the uneasy feeling that opinion surveys may suffer from the problem of people unwilling to speak out their minds. That was found to be true, for example, even in the case of exit polls which, I felt, typically have the most insensitive questions. Another problem is the low response rates.

The World Bank invited 662 stakeholders to participate in their opinion survey. It was a pity that only 173 (23%) responded. Yet 3 stakeholders didn't have any answer for the Development Priority question (item a2_1 to a2_35) and out of the remaining 170 stakeholders, 22 didn't answer the question on which stakeholder group they belong. So my plots just covered 148 stakeholders (22%) out of 662.

At the beginning I felt rather uneasy about the low percentage of response (22 or 23%) of this survey. That means users may have to look beyond the survey data to make up their minds if the data reflect the opinions of the respective stakeholder groups. Anyway I am pretty sure that parallel coordinate plots are highly suitable for analyzing high dimensional data. Also, my primary intention was not the interpretation and making sense out of the analysis results. It was just a modest ambition of sharing my do-it-yourself experience. As this sharing would have my “easier done than said” twist, I went on happily doing my parallel coordinate plots.


All the plots for the World Bank Opinion Survey shown in this post were based on the microdata mentioned earlier. The microdata included the codes for nine stakeholder groups used in the analyses for the survey report. The number of respondents who responded to the question on which stakeholder group they belong as well as the question on development priorities were:
The plots would have been more readable if the Development Priority items were in full text instead of their codes. However that would take too much space and would leave the actual plot area too small. So we will have to refer to the list below:
I find ggplot2 not easy to learn but it works great. I don't know much about R graphics or particularly ggplot2 for that matter. But I guess ggplot2 produces the prettiest complex graphics from your data.

I have zero experience of ggplot2 before I started working on these plots. I worked through trial and error with the help of various tutorials and question-answers from Cross Validated and Stack Overflow, among others. My errors were much more than my trials, as one cartoon character said. But I've finally made it.


Tuesday, June 13, 2017

Playing with published data


The easiest way to try to make some sense out of data published in reports may be to make graphs and/or sort the data to see if there is some recognizable pattern. It is normal to see almost all statistical reports included graphs to try to communicate and highlight their notable results. Arranging the data in a particular theme in ascending or descending order is less common but some extensive statistical reports like a census report produce tables of data with some variables of interest sorted by provinces or some other administrative regions with the region with highest score at the top and that with lowest score at the bottom.

Graphing from data and sorting data from data in some electronic format could both be done quite well with Excel or some other spreadsheet. But only if you know how to get them into your spreadsheet first. The easiest way to do it would be when you could download the data in what is called a data file with “csv” extension. A Comma-Separted-Value (csv) data file can be opened with a spreadsheet directly and then saved as an Excel file or other spreadsheet file if you wish. Now smarter people will use what is known as an “api” or application programming interface provided by the data provider to get data from the Internet.

For me playing with published data should be as natural as children playing with sand on the beach. Here in Myanmar it used to be that not all data of public interest collected from people were published, or if published they were not always publicly available. In one instance, I was even told by a government official that I couldn't cite data from their published report. It was fifteen years ago, though, and I was officially collecting some indicators for the ASEAN Secretariat. If knowledge is power, it certainly wasn't people's power, I thought. Hopefully everything has changed now as exemplified by the offer of DHS microdata to researchers when the results came out recently.

For generating data of public interest, Demographic and Health Survey (DHS) usually supported by USAID and Multiple Indicators Cluster Survey (MICS) supported by UNICEF are the two most popular surveys in the developing countries. We Myanmars have seen a series of MICS being carried out in our country but the DHS Myanmar 2015-16 is the first DHS for us and its report is available here.

The good news is that you could register and request the microdata for this DHS apart from macro data and information available freely through the reports and the hosted database.

Quickly going over the DHS report, I noticed what seemed to be a somewhat strange shape of the population pyramid. I visually compared it with the population pyramid of the Myanmar Population Census 2014 report.


It seems like the age range 15-29 in DHS is pinched appreciably. So I tried putting the two pyramids on the same graph as shown below.


Why this difference? We know that a large number from the working age population has gone out to work in neighboring countries and elsewhere, and therefore it seems like the reduced proportion of 15-34 age range in males and 15-29 in females may be explained by this fact. However, we note that the populations graphed by both the DHS and Census were enumerated on the same defacto basis. So it seems like the population 15-34 has been genuinely under represented in the DHS. However, I am not smart enough to understand if that would have significant impact on the the survey results or not. Surely real statisticians could make it understandable to the ordinary folks.

Anyway, my real intention is to share a few dumb techniques I picked up to extract data from postscript or pdf files to csv files and make them into graphs after reading them into a spreadsheet. The particular type of graph we are going to make is a population pyramid which many of the users of Excel or other spreadsheets may not be familiar and find it hard to do.

My target audience is the fellow dummies in Myanmar. More widely the general public. Here in Myanmar most still use pirated software, I guess. But, pardon me, I have been using freeware or opensource software for quite a long time. And I strongly encourage others to do so. Why should we be enslaved? Still?

First we'll extract data from a document in pdf format. Normally we open such document with Adobe Reader which comes free. If you want to extract a picture of a data table in that document to put it in your report, you could easily use the “Take a snapshot” tool. But there is no way you could cut a table and then paste it somewhere using the Adobe Reader. To do so I used the Tabula software available for free here. To manipulate and graph the extracted csv data you need a spreadsheet and I recommend Open Office Calc spreadsheet which is a component of the Open Office software available here. Open Office is a dependable alternative to the Microsoft Office software and it is completely free.

The materials used will come from the DHS report available here and the Myanmar Population Census report available here.

I created the graph of population pyramid from DHS report superimposed on the population pyramid from the Population Census report that is shown above with the following steps:
Step-1: Run the Tabula software by double clicking its shortcut.
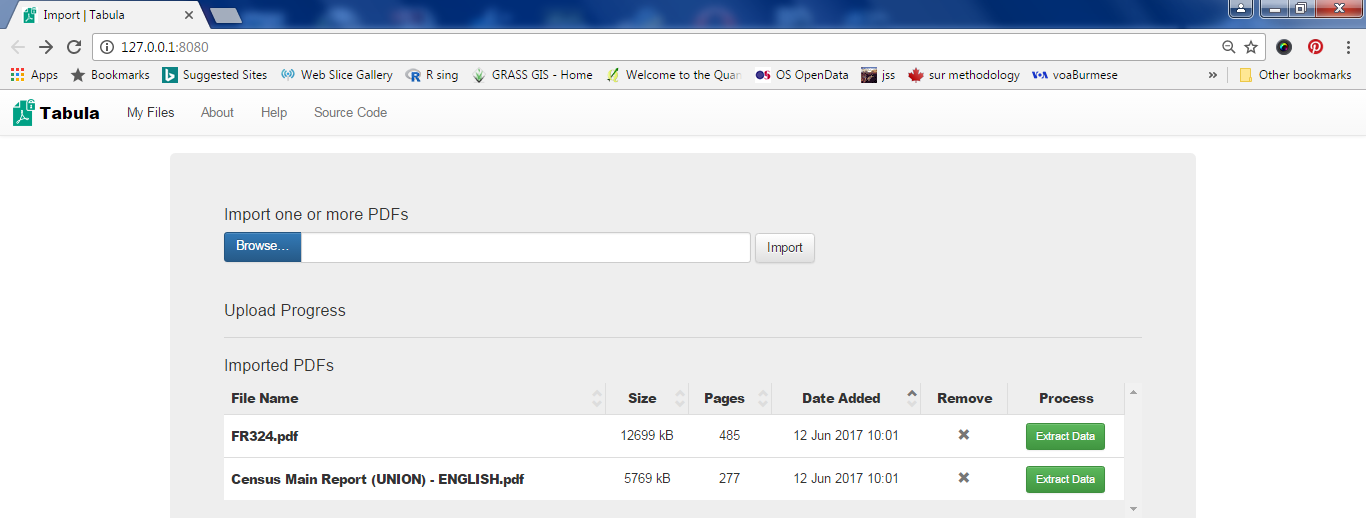
I assume that you have installed the Tabula software and know how to create the shortcut on the desktop of your PC. Now Tabula will be opened and waits for you to specify the pdf files to import. Note that I've specified the names of the two above files and clicked the Import button in the following screenshot.


Now you click the green button to extract data. Here you scroll down to page-52 in the DHS report where the Table 2.7 for population pyramid data is and select the data to be extracted (area shown in pink).


Then click the green button and you get the data preview.


Is the data OK? No! The first column puts “Age” and “Male” together. Well, read the hints given in the text on the left-most side of the Tabula screen and try to adjust the selection so that you get the preview right.


Then saved the data as csv by clicking the Export button.

Step-2: Manipulate data in spreadsheet.
Now I opened the resulting csv file with Open Office Calc:


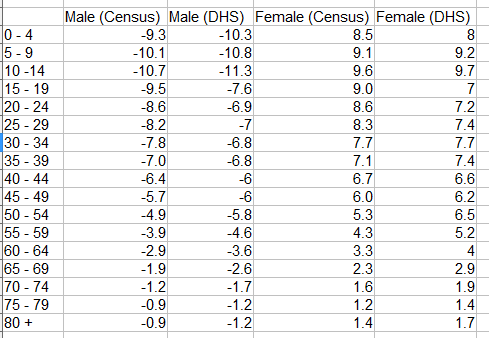
Similarly I exported the Table A-6a giving the population by five-year age groups and sex from the Census report to csv format and opened with Open Office Calc. Collecting the two data sets in a spreadsheet and after the extraction of columns and some arithmetic, I get the following table that has all the information needed to create my population pyramid:


Step-3: Graph it.
The above table shows percentages of males and females of different age groups in their own groups. Notice that males are shown as negative percentages. This is because we need to use a bar chart to draw a population pyramid with males on the left of the X-axis.

Another trick is to align the bars for males(left) and females(right) in the same age group perfectly level. You do this by overlapping bars by 100%.


The final trick is to show percentage labels -15, -10, -5 without the minus signs by changing the number format of the Y-axis.


After adding the title and adjusting colors, lines, font, legend and so on, you should get the final graph:


Friday, February 10, 2017

The Story of Pan-Myaing-Le IV: Ramblings


I've heard that one of our most powerful men one time condemned attempts to study Myanmar-sar abroad as he had conceived of such initiatives. Though that was many decades ago, I'm sure he would have known that the science of linguistics existed a long time before his patriotic gesture.

With a plenty of free time to kill (in terms of day to day assessment; it will be silly to think in terms of weeks and months, let alone years for a guy of my age) I tried reading a bit about linguistics. I'm perfectly aware that my day to day time frame would not allow me to become a linguist of any sort. Well I came across concepts like scripts, phones, phonemes, philology, phonology and phonetics, lexicography, epigraphy, and those other unfamiliar terms. I thought I could grasp what they intend to mean and, that much, I am happy. On the other hand I am aware that I am losing control of my STM (short term memory) and as I ramble with readings of such new ideas, I often go into dreams.

One of my dreams was the coming of age of a Myanmar Language Department at the University of Yangon (and other Universities) where whatever science, art or other discipline will be used by all lovers of this language to come together to study and, simply, enjoy. And I also dream of an institute of linguistics with all its modern trappings to learn and do research on past and present languages of South East Asia, including the languages of our own minorities and decipher a lost language like Pyu.

Quite a while ago one of my younger friends said people graduated out of medical and engineering schools here in Myanmar consider themselves a class apart from others. While we have seen our engineering graduates toiling away in Singapore (and may be in other places) we also have seen medical graduates choosing to work as businessmen in different areas locally. Currently we see a significant number of medical graduates happily working in national politics or as various pundits in NGOs or INGOs. Well, if you don't see such examples as careers misplaced you would be grateful that the cream of our society choose to work in those areas where any other ones among our lesser beings would certainly fail. Nevertheless, what I overheard recently from the conversation of a mother with her friend was baffling. It seemed that one of her daughter is attending medical school and the mother was bitterly against her daughter's boyfriend. The climax of the story is that this boy asked his girlfriend to convince her mother that though he would be graduated as a medical doctor he would be going into business as he is perfectly aware that he wouldn't become rich with medical practice! Has this to do with children's or parents' (common?) mindsets of these times?

Weeks ago I've read a newspaper article lamenting that no one has enrolled for the undergraduate COE programme for History at the main campus of the revitalized Yangon University. I tried looking for more information at YU website. I tried to find the enrollment information. There was none. May be I didn't look hard enough. Anyway, I suppose I found more information on the Wiki page than on the University's own sites. Then I was looking for more information about the Myanmar Language programme and the participants and professors and their research. There isn't much either. I'm a somewhat old fashioned guy. But I am not as old fashioned as my godgrandpa who utterly refused to believe that man reaches the moon. I am illiterate in linguistics but wish to pick up scraps of knowledge so as to be proud of our people and our languages without being completely blind about what I am to be proud of.

Then there was this controversy between the Tagaung and Kyaukse theories of the origin of the Bamar people. I don't know if this controversy is still current and remain unresolved. If so, I wonder if DNA analysis would not resolve the controversy once and for all. DNA analysis may also offer the clues for solving the mystery of how the Pyu people vanished. Isn't it high time to do away with politically loaded pseudo-science from our lives?

As I browsed the web content on Myanmar script I was led to believe that the rounded form of the script evolved when we started writing (inscribing) on the palm-leaves with the stylus. It was argued that the scribes could not use the preexisting form of squarish scripts as we see with stone inscriptions. It is easy to see that squarish forms would tend to tear the palm-leaves more than the roundish form of the script. For ordinary people in those days it is hard for me to believe that their need for day-to-day writing could only be served by the stone slabs as the medium. Also, wouldn't it be hard for inscribers to compose the inscriptions in their heads or asked others to dictate as they work? Alternatively, could they not be using the drafts inscribed on palm-leaves? If so, rounded form of script wouldn't be the primary ones?

On the other hand imagine that a painted form of palm-leaf manuscripts where text had been written with a (reed) pen existed where squarish form of Burmese (Myanmar) script and that they were found to be predating the rounded scripts inscribed by stylus. Then certainly the square script came first. Or was it?
The above is an example of the earliest surviving Indian painting in existence and date from the late Pala period (1000-1200 AD) according to Sacred Leaves: The Conservation and Exhibition of Early Buddhist Manuscripts on Palm Leaves by Yana Van Dyke. And “Palm leaves have traditionally been written upon in two ways: either the text has been incised into the surface or written on the surface. ...The other technique of writing on the surface is with a pen, most likely made of reed, utilizing an ink composed of flame carbon with a binder. The smooth, slick, oiled, flat, and dense epidermal layer allows for the reed pen to flow smoothly and distribute the ink fluidly and uniformly on its surface.”

Do we have such a tradition of painting and writing on palm-leaves? I don't know, but I felt there is no reason that we shouldn't have any.

The following observation from Lammerts strengthen this view that writing with some kind of pen or painting with brushes existed in the Bagan period:

10 The Burmese epigraph cited in note 7 mentions the donation of 55 kam kū chān, which in later Burmese, refers to steatite or soapstone, most commonly associated with writing on black parabaik, but also used on metal, lacquered, or gilded manuscripts. It is not entirely certain that the term has the same meaning here, but it is evident that this is an implement used for writing on parabaik held by a cartridge (kam kū tam 1 kleññ), as were soapstone crayons in later eras. The inscription further mentions a number of minerals such as copper, sulfite and minium, which were used to make colored ink or paint, although no pen- or brush-like implements are named.

Note 7 mentioned that the medium for writing “parabaik” was found at least in one stone inscription but wasn't clear what the material was:

Note that there is only one epigraph from 1223 documenting the use of purabuit and from the context, it is not entirely clear that the material is paper. In later eras, the appellation “parabaik” was also applied to supports such as metal, wood, or leather.

Thinking of the stone inscriptions, wouldn't had some king or abbot or noble man asked for a scaled down version or a full sized clay-slab model before giving the green light? If none of the half-finished rejected stone inscription could be found, that could mean that draft text on palm leaf or clay slab models had probably been used. Nevertheless, linguists and historians may find these musings idiotic and easily refutable and then I would be more than happy to learn of these.

Looking for the clue for introduction of linguistics science into our land, I found that (the first ever or just an early?) seminar on linguistics was held on March 1-3, 1954 by the Burma Research Society in Rangoon. Anna Allot in “Professor U Pe Maung Tin (1888—1973): The Life and Work of an Outstanding Burmese Scholar” noted that:

I was myself taking part in this seminar and have a record of it in my diary, where I have noted, “This lecture was chiefly about the topics U Pe Maung Tin and I had talked about when reading together his Burmese Syntax: about subject, object, noun-verbs, and submerged subjects. He did start by saying that Burmese consists basically of nouns, verbs, and particles.”

Also, Allot's paper contained the details on this seminar that appeared in an article in The Nation newspaper of March 6, 1954.

I wonder if our linguists have come a long way since this groundbreaking seminar.


Wednesday, December 14, 2016

The Story of Pan-Myaing-Le - III: Burmese inadequate for the modern world?


“YANGON, Myanmar — It’s the dawn of democracy in Myanmar. If only the Burmese had their own word for it.
As this former dictatorship opens to the world, language is a stumbling block.”

The opening sentence from the article “Those Who Would Remake Myanmar Find That Words Fail Them” that appeared in The New York Times on July 19, 2015 could have meant for bigger things than to simply irritate us. Surely the author Thomas Fuller couldn't have forgotten that neither the word “democracy” was their own nor ours, for that matter, at least originally.

Yet I was somewhat disheartened by this one from the Fuller quotes:

“Burmese has a far poorer political vocabulary than English,” said U Thant Myint-U, a historian who also serves as an adviser to the president. “At a time when everything is about the country’s political future, it’s a liability and a constraining factor.”

Still, I want to question whose liability it was and whose liability will be for now. The past was all so clear and hardly need pointing fingers. Then for now and the future there's no choice. The responsibility to convert liabilities, if any, to assets is ours.

But I wasn't at all troubled by this application developer's lament.

"When I talk about my work to my mother and her friends, I can't explain it in Burmese," said Daw Ei Myat Noe Khin, a software and app developer in Yangon. …

“When I talk about my work to my mother and her friends, I can’t explain it in Burmese,” she said.

Does she need to explain to her mom and her friends about the complexities of her work as if to her co-workers and her peers?

“There is no word in Burmese for developer, so I used the English word programmer,” she said. “If they don’t understand programmer, I say, ‘It’s what is inside your phone and makes it work.’”

But this may be exactly what they need to know and would like to know.

“They say, ‘Oh, it’s something to do with computers!’”

And Fuller didn't spare us the freedom of calling computer as “ကွန်ပျူတာ” in our language:

And they say it using the English word.
There is no Burmese word for computer. Or phone, for that matter.

Highlighting the follies of being lost in translation, Fuller could have been inherently pessimistic, or quite amusing at times, according to your taste:

Mr. Thant Myint-U, … , says he has been in meetings between the president and foreigners where translation is done by some of the country’s top interpreters. “Ten percent is still lost in translation,” he said.
Vicky Bowman, a former British ambassador to Myanmar, says 10 percent is optimistic. “I would say it’s more like 30 percent to 50 percent,” she said.

Ms. Bowman is director of an organization called the Myanmar Center for Responsible Business. When she and her colleagues wanted to translate the name of her organization for Burmese speakers, it took hours. They came up with a Burmese name that in English sounds like a bad Internet robo-translation: “Myanmar economic sector having and assuming the responsibility, support-help department.”


To me this is as effective as a word by word, complete refutation of Thomas Fuller by a linguist. It seems like you may choose to read only this article and still would not be loosing or distorting any of Fuller's observations or arguments. Here are some samples.

On the Fuller article:

The article is full of fallacies, bad arguments, and misinformation that leaves us with the impression that Burmese is linguistically impoverished, and that the speakers of the language have no chance of making it in the modern world.
…
Thomas Fuller, would rather you walk away with the idea that Burmese is uniquely weird and its speakers are linguistically disabled. He seems to have little idea how translation or linguistics works, and he presents mundane issues in language variation as insurmountable obstacles for Burmese speakers. There’s also some good old fashioned linguistic relativity thrown in too, letting us know that if the Burmese don’t have a word for something, they probably can’t think about it properly. I love that pseudoscience from the 1930s is still having some influence on journalists today.

On the allegation that Myanmar language is stunted (highlighted text by Fuller): Not to worry. Myanmar certainly is not crippled. We could crawl, walk, and then run.

“Limited access to global media and creaking connections to the Internet stunted the evolution of the Burmese language, leaving it without many words that are elsewhere deemed essential parts of the modern political and technical vocabulary”

... It’s not a “stunted” language because it isn’t yet common for speakers to acquire Western technology. This is sort of like saying that Congolese languages of Central Africa are stunted for their lack of words referring to snow and ice. How will people speaking those languages ever be able take part in the discussion on global warming without words for “glacier”, “sea ice”, or “permafrost”?

This article has a very alarmist tone to it, like “oh my god what are those Burmese going to do? How will they survive?”. They’ll do the same thing everyone else did when they started to use computers: they’ll just make new words. ...
On the linguistics of the Myanmar language:
“The structure of the Burmese language, part of the Sino-Tibetan language family, varies considerably from English. Written Burmese has no spaces between words and is generally wordier than English.”
This is literally the only hard linguistic data provided in the entire article, and it’s totally useless.
Burmese has no spaces in writing. Why do we care? How is this relevant? How does this prevent them from understanding what a democracy is, or how to translate the word ‘privacy’? Written Chinese has no spaces either, and that country is an economic and technological powerhouse. The fact is only here to further that author’s attempt to paint Burmese as a primitive language.
On the loanwords in Myanmar language:

““They [Burmese speakers] say, ‘Oh, it’s something to do with computers!’ ”
And they say it using the English word.
There is no Burmese word for computer. Or phone, for that matter.”

This is the concluding paragraph of the article, and it really shows how the author fails to understand what a loanword is. This is really too bad, since the concept is central to whole article. Saying that Burmese has no word for ‘phone’ or ‘computer’ is a bit like saying that English has no word for ‘kangaroo’, ‘igloo’ or ‘kindergarten’ because these are borrowed from other languages. If we really wanted to push it, we could even say that English has no word for ‘phone’ either, because that’s a borrowing from Greek (the prefix ‘tele-‘ is also Greek). At some point, after a word gets borrowed, it becomes a native word, and it is silly to treat it like a borrowing anymore. The pronunciation of the words has shifted to match the borrowing languages, and it becomes integrated into the grammar.

Then there were the refutations on Fuller which my selection gives but a subjective glimpse. You shouldn't miss reading the article, think, and decide for yourselves.
Back to the story of our software developer cited by Fuller. In real life I imagine that most of us would have been in a situation like her. Once or twice my mom and my step-father, long dead and gone, asked me about the Government job I held, when I was freshly recruited. They didn't really care for the answer. They were just immensely proud.

But if she really want to explain about her work to common folks who seriously want to know, I've just been thinking about tipping her with the story of what the famous mathematician Henri Poincare said about making a scientific discovery and rushing out to the street to explain to the first person he met. Or a more recent idea of explaining to a potential donor about your project during an elevator ride (the elevator test). But then I couldn't get the right quotes from the Web in time.

So I turned to my old trick of Googling and searched for “explaining science to layman”. Even with the first page of results I know I was on the right track:

As I went on looking I found this: “Explain it to me like I'm a kid: scientists try to make sense of gravitational waves” on theguardian website, February 12, 2016. It was about the “blockbuster announcement that scientists had detected gravitational waves, ripples in the fabric of spacetime that were first anticipated by Albert Einstein a century ago” that was made just a day before.


And I said to myself: Forget what all those guys said about “Burmese”. I'm sure some Myanmar would be able to present in our own language the contents of this article about gravitational waves which the experts have tried to “really break it down in its simplest terms – as though we were children”. And I'm sure the translation could be done admirably.

After that if anyone is still skeptical about any Myanmar capable of communicating or grasping the essence of such phenomena and advanced concepts, let's see.